Fig. 1
From: Genetic and metabolic links between the murine microbiome and memory

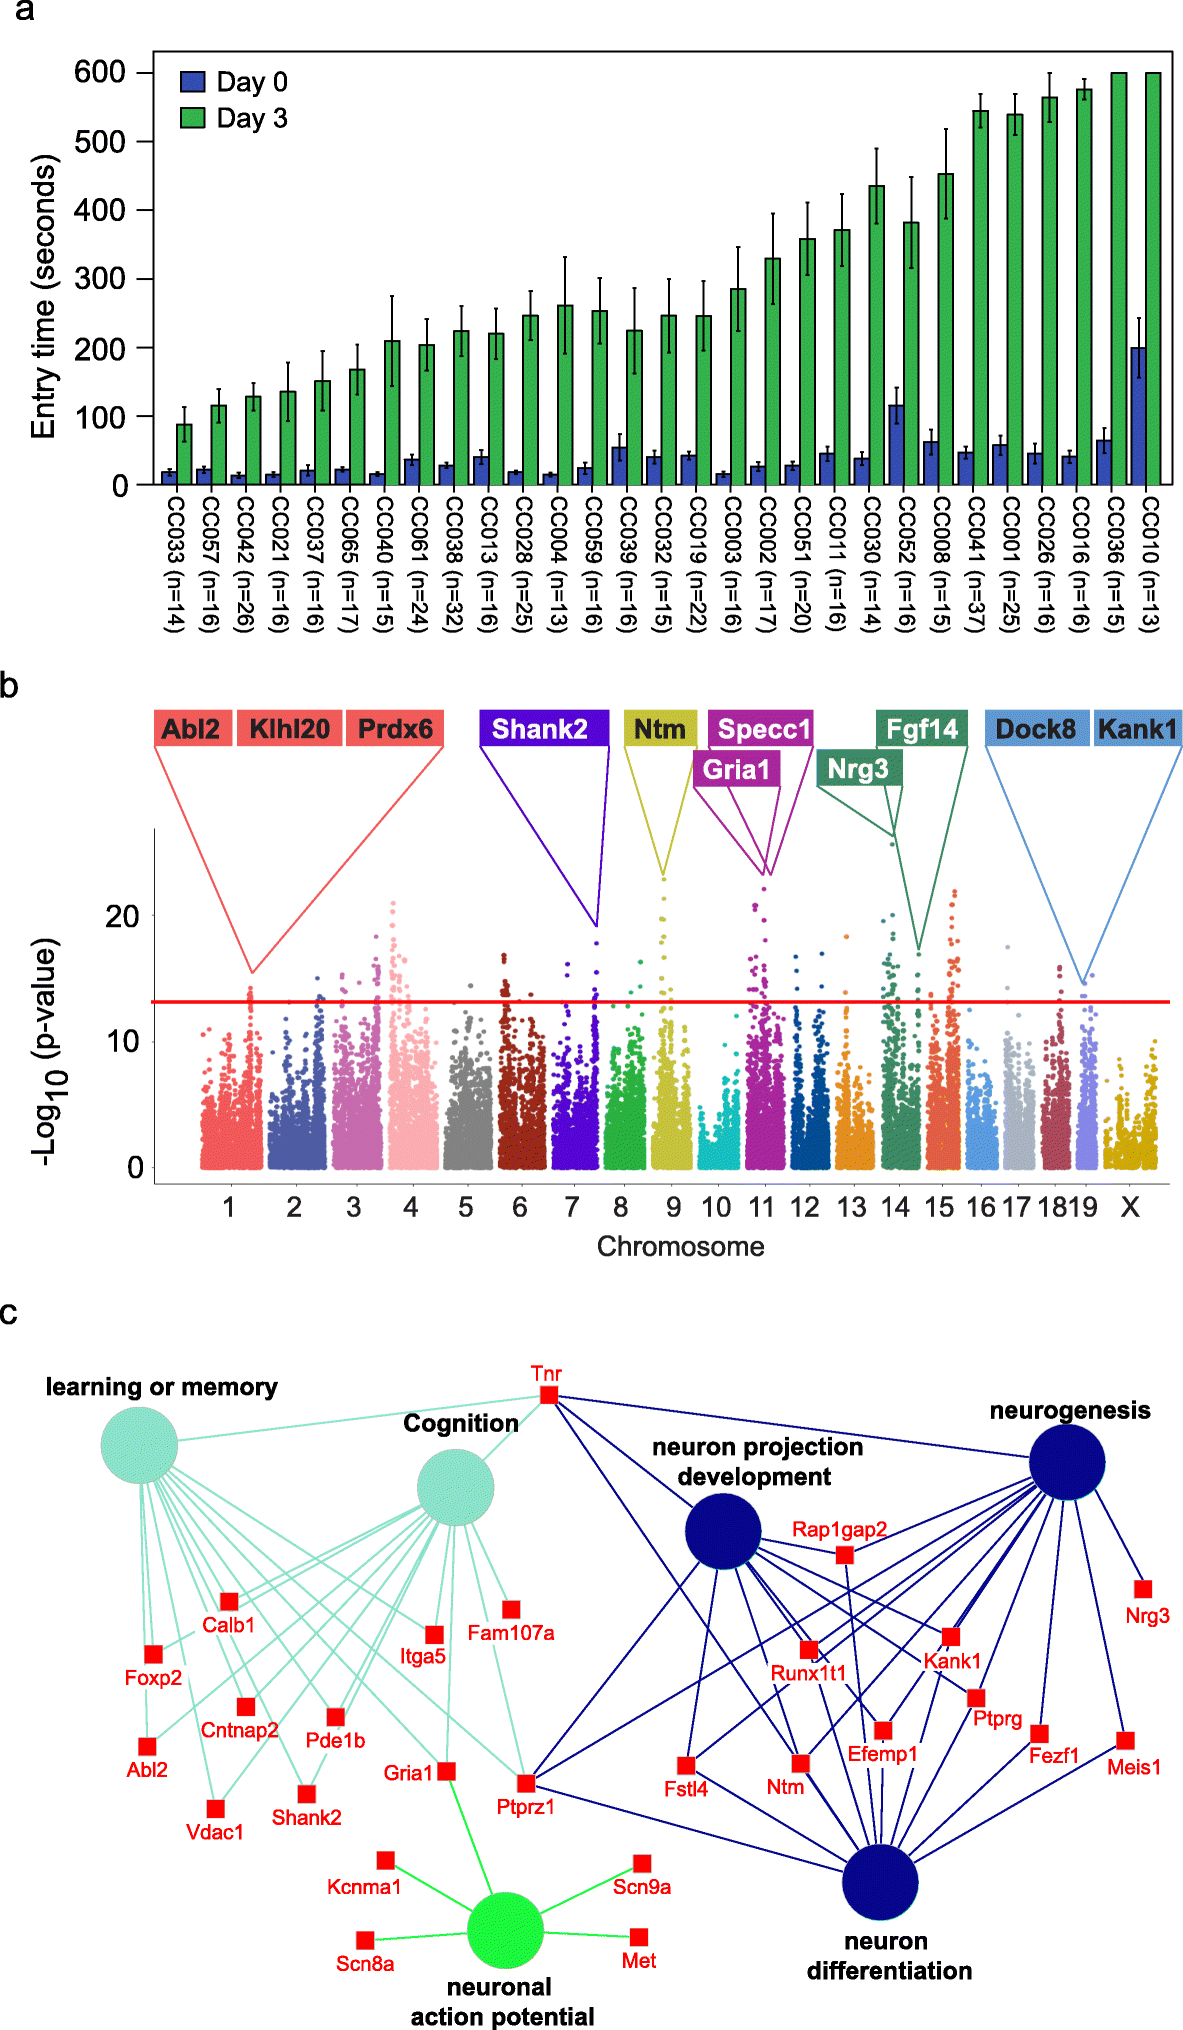
Identification of genetic variations and candidate genes associated with memory in CC mice. a Variations in memory across CC strains. Memory was assessed using passive avoidance, a fear-motivated test. The memory test is based on latency of entry into a compartment where 3 days earlier a mild foot shock (0.3 mA for 5 s) was experienced. Entry into the shock compartment on Day 0 is shown in blue, whereas entry 3 days after the foot shock is shown in green (Day 3). Mice with good memory avoided entering the chamber on Day 3, whereas mice with poor memory entered the chamber. Error bars indicate mean ± SEM. b Manhattan plot of the GWAS analysis for memory in CC mice (n = 535 mice). The – log10(P value) is shown for 76,080 SNPs ordered based on genomic position. The horizontal red line indicates the QTL significance threshold at − log10(P value) = 12. Candidate genes previously associated with memory, cognition, or other neurodevelopmental processes located in representative QTL are listed above the plot. c Gene ontology (GO) analysis of genes identified in QTL associated with memory potential in Fig. 1b (n = 535 mice). Genetic loci are significantly enriched for genes implicated in learning or memory, cognition, neuron projection development, neurogenesis, neuron differentiation, and neuronal action potential