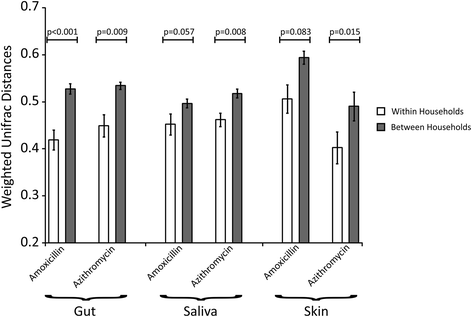
Fig. 2
From: Microbial diversity in individuals and their household contacts following typical antibiotic courses

Bar graph representing mean weighted UniFrac distances (±standard error) within a household (white bars) and between different households (gray bars) based on the antibiotic received in each household. The y-axis represents mean weighted UniFrac distances, while the body site sampled and antibiotic received within each household is represented on the x-axis. p values were determined using the Mann Whitney U test